

Next: Dependence of on the
Up: Effect of Trends on
Previous: Higher order DFA on
Noise with Power-law trends
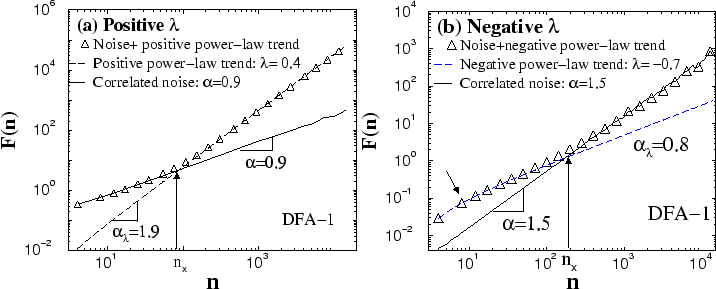
Figure 10:
Crossover behavior of the rms fluctuation function
 (circles) for correlated noise (of length
 ) with a superimposed power-law trend
 . The rms fluctuation function
 for noise (solid line) and the rms fluctuation function
  (dash line) are also shown for comparison. DFA-1 method is used. (a)
 for noise with correlation exponent
 , and power-law trend with amplitude
 and positive power
  ; (b)
; (b)
 for Brownian noise (integrated white noise,
 ), and power-law trend with amplitude
 and negative power
  . Note, that although in both cases there is a ``similar'' crossover behavior for
 , the results in (a) and (b) represent completely opposite situations: while in (a) the power-law trend with positive power
  dominates the scaling of
 at large scales, in (b) the power-law trend with negative power
  dominates the scaling at small scales, with arrow we indicate in (b) a weak crossover in
  (dashed lines) at small scales for negative power
  .
.
 |
In this section we study the effect of power-law trends on the
scaling properties of noisy signals. We consider the case of
correlated noise with superposed power-law trend
 , when
  is a positive constant,
 , and
, and  is the length of the signal. We
find that when the DFA-1 method is used, the rms fluctuation
function
 exhibits a crossover between two scaling regions
[Fig. 10]. This behavior results from the fact that at
different scales
  , either the correlated noise or the power-law
trend is dominant, and can be predicted by employing the
superposition rule:
![\begin{displaymath}
\left[F_{\rm\eta P}(n)\right]^2 = \left[F_{\rm\eta}(n)\right]^2 + \left[F_{\rm P}(n)\right]^2,
\end{displaymath}](img292.png) |
(18) |
where
 and
and  are the rms fluctuation
function of noise and the power-law trend respectively, and
 is the rms fluctuation function for the superposition of the noise and the power-law trend. Since the behavior of
 is known (Eq. (6) and Appendix 7.1), we can understand the features of
 , if we know how
  depends on the characteristics of the power-law trend. We note that the scaling behavior of
 displayed in Fig. 10(a) is to some extent similar to the behavior of the rms fluctuation function
 for correlated noise with a linear trend [Fig. 1] -- e.g. the noise is dominant at small scales
  , while the trend is dominant at large scales. However, the behavior
  is more complex than that of
  for the linear trend, since the effective exponent
 for
for  can depend on the power
  of the power-law trend. In particular, for negative values of
  ,
,  can become dominated at small scales (Fig. 10(b)) while
 dominates at large scales -- a situation completely opposite of noise with linear trend (Fig. 1) or with power-law trend with positive values for the power
  . Moreover,
  can exhibit crossover behavior at small scales [Fig. 10(b)] for negative
  which is not observed for positive
  . In addition
  depends on the order
  of the DFA method and the length
  of the signal. We discuss the scaling features of the power-law trends in the following three subsections.
Subsections


Next: Dependence of on the
Up: Effect of Trends on
Previous: Higher order DFA on
Zhi Chen
2002-08-28

