This method was first proposed in: Peng C-K, Buldyrev SV, Havlin S, Simons M, Stanley HE, Goldberger AL. Mosaic organization of DNA nucleotides. Phys Rev E 1994;49:1685-1689.
A detailed description of the algorithm and its application to physiologic signals can be found in: Peng C-K, Havlin S, Stanley HE, Goldberger AL. Quantification of scaling exponents and crossover phenomena in nonstationary heartbeat time series. Chaos 1995;5:82-87.
Please cite at least one of the above publications when referencing this material, and also include the standard citation for PhysioNet:
Goldberger AL, Amaral LAN, Glass L, Hausdorff JM, Ivanov PCh, Mark RG, Mietus JE, Moody GB, Peng C-K, Stanley HE. PhysioBank, PhysioToolkit, and PhysioNet: Components of a New Research Resource for Complex Physiologic Signals. Circulation 101(23):e215-e220 [Circulation Electronic Pages; http://circ.ahajournals.org/content/101/23/e215.full]; 2000 (June 13).
The method of detrended fluctuation analysis has proven useful in revealing the extent of long-range correlations in time series. Briefly, the time series to be analyzed (with N samples) is first integrated. Next, the integrated time series is divided into boxes of equal length, n. In each box of length n, a least squares line is fit to the data (representing the trend in that box). The y coordinate of the straight line segments is denoted by yn(k).
Next, we detrend the integrated time series, y(k), by subtracting the local trend, yn(k), in each box. The root-mean-square fluctuation of this integrated and detrended time series is calculated by
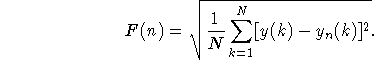
This computation is repeated over all time scales (box sizes) to characterize the relationship between F(n), the average fluctuation, and the box size, n. Typically, F(n) will increase with box size. A linear relationship on a log-log plot indicates the presence of power law (fractal) scaling. Under such conditions, the fluctuations can be characterized by a scaling exponent, the slope of the line relating log F(n) to log n.
Software for DFA
The file dfa.c is the C language source for a program that performs detrended fluctuation analysis of a time series. Read about how to use this program here (or download this information in Unix man page format here).
The instructions below assume that you already have a C compiler, such as gcc, and a make utility, such as GNU make. Most GNU/Linux and Unix systems have these already. Under MS-Windows,we recommend the versions of gcc and make included in the free Cygwin development environment; under Mac OS X, use the versions included in Apple's XCode tools.
- Download dfa.c, Makefile, a sample input file (rr-intervals), and the corresponding output file (rr-dfa).
- Build dfa by typing:
make
- Test the compiled dfa by typing:
make check
- If dfa passes the test, install it by typing:
make install
If you wish to use some other C compiler, compile dfa.c and link it with the standard C math library, using whatever method is standard for your C compiler. See Makefile to see how to test the executable file that you compile.
Further information
Learn more about applications of DFA to physiologic time series in our tutorial, Fractal Mechanisms in Neural Control. Also see the references at the top of this page.
Two papers also available here discuss the effects of trends and nonstationarities on DFA.
As of August 2012, the two original papers describing the DFA method had been cited by about 1500 research articles.
|
If you would like help understanding, using, or downloading content, please see our Frequently Asked Questions. If you have any comments, feedback, or particular questions regarding this page, please send them to the webmaster. Comments and issues can also be raised on PhysioNet's GitHub page. Updated Tuesday, 04-Oct-2016 21:25:36 CEST |
PhysioNet is supported by the National Institute of General Medical Sciences (NIGMS) and the National Institute of Biomedical Imaging and Bioengineering (NIBIB) under NIH grant number 2R01GM104987-09.
|