

Next: Noise with sinusoidal trend
Up: Noise with linear trends
Previous: DFA-1 on noise with
DFA-2 on noise with a linear trend
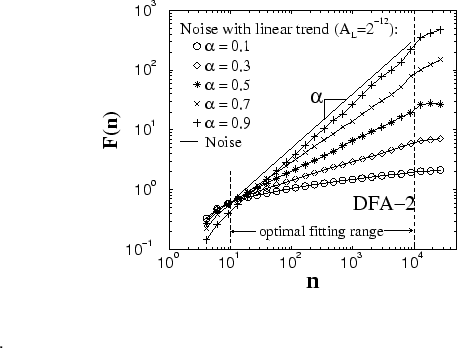
Figure 4:
Comparison of the rms fluctuation
function
 for noise with different types of
correlations (lines) and
 for the same noise
with a linear trend of slope
 (symbols) for DFA-2.
 because the integrated linear
trend can be perfectly filtered out in DFA-2, thus
 from Eq.(3). We note, that to estimate accurately the
correlation exponents one has to choose an optimal range of scales
 , where
  is fitted. For details see
Appendix 7.1
 |
Application of the DFA-2 method to noisy signals without any
polynomial trends leads to scaling results identical to the
scaling obtained from the DFA-1 method, with the exception of some
vertical shift to lower values for the rms fluctuation function
 [see Appendix 7.1]. However, for
signals which are a superposition of correlated noise and a linear
trend, in contrast to the DFA-1 results presented in
Fig. 1,
 obtained from
DFA exhibits no crossovers, and is exactly equal to the rms
fluctuation function
 obtained from DFA-2 for
correlated noise without trend (see Fig. 4).
These results indicate that a linear trend has no effect on the
scaling obtained from DFA-2. The reason for this is that by design
the DFA-2 method filters out linear trends, i.e.
 (Eq.( 3)) and thus
 due to the superposition rule (Eq. (8)). For the same
reason, polynomial trends of order lower than
  superimposed on
correlated noise will have no effect on the scaling properties of
the noise when DFA-
 is applied. Therefore, our results
confirm that the DFA method is a reliable tool to accurately
quantify correlations in noisy signals embedded in polynomial
trends. Moreover, the reported scaling and crossover features of
 can be used to determine the order of polynomial trends
present in the data.


Next: Noise with sinusoidal trend
Up: Noise with linear trends
Previous: DFA-1 on noise with
Zhi Chen
2002-08-28

