On this page:
- Introduction
- Using the MIMIC II Clinical Database
- Using the MIMIC II Waveform Database
- Linking Clinical and Waveform Records
Introduction
This tutorial is intended to help you get started on a project that makes
use of the MIMIC II Database,
a large collection of data obtained from intensive care unit (ICU) patients.
If you have used other PhysioBank databases,
some of this material may be familiar, but the MIMIC II Database contains many
types of information that are not available in any other PhysioBank database,
and these notes discuss how to access and interpret this information.
Components
As described on its home pages, the MIMIC II Database consists of a
Clinical Database
and a Waveform Database. Although
it has a number of unique features
described below, the MIMIC II
Waveform Database consists of physiologic signals and time series of
vital signs similar to those in most other PhysioBank databases, and
it is accessible by any of the
same WFDB software that can read
those other databases. On the other hand, the MIMIC II Clinical
Database, derived from medical records, is unlike any other PhysioBank
database to date; its organization and contents are described in
the next section.
Deidentification and Surrogate Data
It is important to note that the portions of the MIMIC II Database
that are posted on PhysioNet have been deidentified (anonymized), by
removal of the 18 types of protected health information (PHI) defined
by the HIPAA Privacy Rule. PHI includes names, addresses, dates,
medical record and other identification numbers, ages if over 90,
precise geographic locations, and a variety of less common types of
information that might be useful for determining the identity of
subjects. Although not defined as PHI by the HIPAA Privacy Rule, we
have also removed names of caregivers, hospitals and clinics, and
other information that might compromise the privacy of the MIMIC II
subjects. Where any such information appeared in the source
materials, it has been replaced by surrogate information in the
database. Thus names have been replaced by surrogate names, locations
by surrogate locations, dates by surrogate dates, etc. The ages of
subjects under 90 were as stated, but ages of 90 and above are all
recorded as 200+.
How is MIMIC II being used?
The MIMIC II Database can support several distinct types of studies:
- Cross-sectional studies
- focus on how observations vary across groups of subjects. Such studies typically require examination of all records that share some set of characteristics in order to determine if they significantly differ from some other group of records. For example, a cross-sectional study by Jia et al. used the MIMIC II Database to examine the association of mechanical ventilator settings with risk of acute respiratory distress syndrome (ARDS).
- Longitudinal studies
- follow subjects over time, aiming to reveal aspects of dynamical change. Some such studies address basic questions in physiology, others may evaluate the efficacy of therapeutic interventions, and still others may be aimed at improving methods for automated diagnosis or medical decision support. For example, in a longitudinal study Sun et al. used the MIMIC II Database to compare a broad assortment of previously described methods for estimation of cardiac output from blood pressure waveforms against intermittent cardiac output estimates obtained by the standard method (thermodilution).
- Data mining
- (or data-directed) studies aim to discover variables that may be related. Data mining may be useful in studies that are cross-sectional, longitudinal, or both, as a complement to a hypothesis-driven investigation. In data collections containing large numbers of variables, such as MIMIC II, relationships among pairs or larger sets of variables may not be obvious a priori. The common hypothesis underlying data mining is that uncovering hidden relationships may lead to useful diagnostic or prognostic insights. The PhysioNet/Computers in Cardiology Challenge 2009, on the subject of predicting acute hypotensive episodes, might be addressed using a data mining approach, by looking for markers that precede episodes in the training set.
Using the MIMIC II Clinical Database
The MIMIC II Clinical Database currently consists of data from the
medical records of about 26,000 ICU patients. Only a small number of
these are currently available on PhysioNet, but all of those whose
subjects are also represented in the MIMIC II Waveform Database (about
4,000) will eventually be posted here. The (text) file
RECORDS
contains a list of all currently posted records in the MIMIC II
Clinical Database.
Logs
For longitudinal studies, it is often most useful to examine the log for each patient. A log records observations of the patient and medical interventions in chronological order, often beginning with a list of ICD9 diagnosis codes from the ICU admitting note. Within these logs, each item of information is recorded with an associated timestamp that specifies when the information became available. Since the log entries are recorded in time order, it is possible to reconstruct the sequence of observations and interventions associated with each patient. In each case, the log spans an entire ICU admission, and in many cases the log includes months or years of medical history before the ICU admission; for those patients who were admitted to the ICU more than once during the study period, the logs include available medical history between the multiple ICU stays.
Logs are available in three formats on PhysioNet:
- HTML logs:
-
The default view of a log is as a web page; for example, point your
browser to http://physionet.org/physiobank/database/mimic2cdb-ps/s20794/
to open another browser window (or tab) with a view of the log for MIMIC II
Clinical Database record s20794. This view allows you to browse
through a case much as you might look through a logbook. It is designed to
be relatively easy to read, but there are other views that will be more
suitable for analysis.
HTML is meant to be rendered by a web browser for visual review; it is needlessly complicated to parse it for any other purpose, given that more suitable alternatives exist. The big advantage of the HTML logs for visual review is that the encoded fields present in the other formats have been decoded, so it is much easier to understand HTML logs than those in the other formats.
- Plain text logs:
-
In the text
view of the same case, a log entry is a line of text that contains
a varying number of fields separated by tab characters. The
first field is the entry timestamp, the second is a
two-character source code that specifies the source of the
information in the entry (for example, the patient's ICU chart, a
physician's order, or a laboratory test), and the remaining data
fields contain the information (for example, the name and value
of a measurement, an ICD9 diagnosis code, or the name and quantity of
a medication). If you need to make use of MIMIC II clinical data
within a computer program, and you are not using WFDB software for any
other part of your study, you may prefer plain text format.
- Annotation logs:
- A third view is also available, in which the log is presented as a WFDB annotation file. WFDB annotations can be related readily to MIMIC II Waveform Database records by a large number of existing applications. If your focus is on waveforms or time series ("trends") and you need to understand what has been happening to the patient at a particular time, the WFDB software that you are using to read the waveforms or time series can probably read annotation logs, too.
The information content is identical in all three log file formats, so you may choose whichever format works best for your study. The HTML and text logs are generated from the annotation logs using software available here; this software also includes a program to translate a properly-formatted text log into an annotation log. Logs in HTML format cannot be translated back into either of the other formats (at least, not with the software provided here).
If you need to edit or otherwise modify copies of these logs (for
example, to incorporate findings of your analysis into them for
reference, exchange with colleagues, or further study), edit either
plain text or annotation logs rather than HTML logs, since edits in
text or annotation files can be propagated to the other formats with
only trivial effort. Furthermore, it is very likely that expanded and
amended versions of these logs will be posted on PhysioNet in the
future, and merging your edits with either plain text or annotation
logs will be much easier than doing so with HTML logs.
Understanding Log Entries
Let's have a look at a few lines from a text log:
[15:48:00 06/09/2016]	ch	t0=[15:00:00 06/09/2016]	id=211	el=0	cu=69	cg=2393	v1=98	u1=BPM	st=NotStopd
[15:48:00 06/09/2016]	ch	t0=[15:00:00 06/09/2016]	id=212	el=0	cu=69	cg=2393	v1=Normal Sinus	st=NotStopd
[23:42:00 07/09/2016]	me	t0=[23:15:00 07/09/2016]	tf=[15:58:00 24/10/2016]	dt=67243	id=131	el=1	cu=69	cg=2404	so=140	vo=0	v1=50	du=mcgkgmin	sv=50	su=vl	rt=IV Drip
The lines above correspond to these entries in the HTML log:
[15:48:00 06/09/2016]
- Chart Event
t0: [15:00:00 06/09/2016]
id: Heart Rate
el: 0
cu: MICU
cg: RN
v1: 98
u1: BPM
st: NotStopd

t0: [15:00:00 06/09/2016]
id: Heart Rhythm
el: 0
cu: MICU
cg: RN
v1: Normal Sinus
st: NotStopd
[23:42:00 07/09/2016]
- Med Event
t0: [23:15:00 07/09/2016]
tf: [15:58:00 24/10/2016]
dt: 67243
id: Propofol
el: 1
cu: MICU
cg: RN
so: N/A
vo: 0
v1: 50
du: mcgkgmin
sv: 50
su: vl
rt: IV Drip
Groups of log entries
The first point to notice in this example is that three entries in the
text log have been grouped into two sections of the HTML log.
Simultaneous entries are common, and the HTML log is structured so
that all entries with the same timestamp are grouped in one section.
When simultaneous entries of the same type occur, they are grouped
together under a common type heading (marked by a bullet point).
About timestamps
Timestamps, such as [15:48:00 06/09/2016] in the example above, indicate the 24-hour time (3:48 pm in this example) followed by the surrogate date (6 September 2016 in this example). The date is shifted forward in time by a randomly chosen number of weeks, which is always the same for any given subject but differs between subjects. The time of day is unaltered from that in the original medical record. Although the format of the timestamps suggests 1-second precision, the effective time resolution is one minute in the existing logs, and discrepancies of a few minutes between clocks used by different caregivers should be expected.
Each entry has a primary timestamp that indicates when the associated information (what follows the timestamp on the same line of the text log) was recorded in the log. Some entries, such as the third one above, contain one or two additional timestamps. Where present, the t0 timestamp indicates the time of the event that was logged. The entry timestamp might be later than t0 because an observation or intervention was logged some time after the event; for example, t0 for a blood test is the time the blood was drawn from the patient, but the results of the test might not be determined and logged until several hours have elapsed. If a study needs to follow the patient's state (for example, to quantify the dynamics of response to an intervention) t0 gives better information about that state as a function of time than the entry timestamp. On the other hand, if a study aims to develop methods for medical decision support based on available information, the entry timestamp is an appropriate basis for determining what information can be used as a basis for a medical decision at any given time.
If a tf timestamp is also present, it indicates the end of a time interval (beginning at t0) during which an event occurred or was expected to occur, such as the period for delivery of a specified volume of intravenous fluid.
In annotation logs, t0 and tf timestamps appear as
intervals in seconds relative to the entry timestamp. In the third
entry illustrated above, for example, t0 is recorded in the
annotation log as -1620 (27 minutes earlier than the entry timestamp).
Source codes and entry types
To make sense of a log entry, we need to know where it came from, which might be any of:
In a text log, each entry contains one of these two-character source codes from the table above. The source code immediately follows the primary timestamp. In an annotation log, the source codes are numeric, as shown above, and in HTML logs, the source codes are replaced by descriptive headings as in the right column of the table.
Source code Meaning ad [1] Additive (to solution) ce [3] Census Event [transfer of patient] ch [4] Chart Event [event recorded in the ICU] de [5] Delivery ic [6] ICD9 [diagnosis code] io [8] I/O Event me [10] Med[ication] Event po [11] Physician Order so [12] Solution to [13] Total I/O [fluid balance] Event
Source codes provide the context needed to decode the remaining data in
each entry.
Name-value pairs
Following the source code in a text log, or in a character string embedded in each entry in an annotation log, are tab-separated name-value pairs containing the clinical data. The names are two-character tags. The meanings of the tags, and the source codes with which they may be associated, are given below:
Tag Meaning [source context] ai Alternate ID [io] am Amount of additive [ad] ap Method of approximation [to] cg Care giver (provider) [ad, ch, de, io, me, so, to] cu Care unit (location) [cd, id, md, ad, ce, ch, de, io, me, so, to] cv Cumulative volume (ml ???) [to] dd ICD9 diagnosis code [ic] de Destination care unit [ce] di Discharge status ds Diagnosis sequence number [ic] dt Event duration (minutes) [cd, id, md, ce, to] du Units for am [ad] or v1 [me, so] el Element ID [cd, id, md, ad, ch, de, io, me, so, to] es Estimate [io] f1 Form of m1 [po] f2 Form of m2 [po] fr Frequency of medication administration [po] fs Schedule of medication administration [po] id Event type [cd, id, md, ad, ch, io, me, so, to] io I/O type [ad, de, so] ld Description of dd [ic] lo Location for medication administration [de] m1 Medication (main component) [po] m2 Medication (base component) [po] m3 Medication (additive 1) [po] m4 Medication (additive 2) [po] nb New bottle [io] pt Procedure type [po] pv Volume per hour [to] ra Rate [de] rs Result status [ch] rt Route for medication [ad, me, po, so] ru Units for ra [de] so Solution type [me] st Stopped/not stopped [ch, io, me] su Units for so [me] sv Volume of so [me] t0 Event start time [cd, id, md, ch, io, me, to] tf Event end time [cd, id, md, ce, po] u1 Units for v1 [ch, po] u2 Units for v2 [ch, po] u3 Units for v3 [po] u4 Units for v4 [po] uh "Units" of fluid hung [io] v1 Value of parameter specified by id [ch, me] or amount of m1 [po] v2 Value of second parameter specified by id [ch] or amount of m2 [po] v3 Amount of m3 [po] v4 Amount of m4 [po] vo Volume [io, me, so] vu Units for vo [io]
Interpreting encoded values
Several of the tags in the table above mark fields that contain encoded information. In HTML logs, this information is decoded (although the decoded strings may still be abbreviated). In text and annotation logs, however, the raw codes are presented; they can be decoded by looking them up in the appropriate code dictionaries:So, for example, we can find the meaning of an id value that appears in an ad entry by looking it up in me-id-dict.
Tag [source codes] Code dictionary cg cg-dict cu, de cu-dict id [cd, ch] ch-id-dict id [id, io, to]; io io-id-dict id [ad, md, me, so] me-id-dict
The MIMIC II code dictionaries are available at
http://physiobank/database/dictionaries/, where they can be read directly by applications that use the
WFDB library, such as
loghtml. If you wish to
improve the translations, download the dictionaries, edit them as desired, and
install them in /usr/local/dictionaries/, where WFDB applications
will be able to find them.
Putting it all together
A set of logs consisting of a few entries of each type (including the
examples above) is available as a MIMIC II Clinical Database record
named "sample". In
addition to the annotation, text, and HTML logs, a commented version
of the HTML log, with interspersed entries from the text log, is
provided as a guide to interpreting MIMIC II logs.
Viewing and downloading logs
To obtain a log, do one of the following:
- See the HTML log by clicking on the name of the record on the MIMIC II Clinical Database home page.
- View or download a text view log by appending record.txt to the URL of the HTML log (for example, http://physionet.org/physiobank/database/mimic2cdb-ps/s20794/s20794.txt); or simply follow the link at the top of the corresponding HTML log.
- Download an annotation log by appending record.log to the URL of the HTML log (for example, http://physionet.org/physiobank/database/mimic2cdb-ps/s20794/s20794.log). In order to use an annotation log, you will also need the corresponding WFDB header file (for example, http://physionet.org/physiobank/database/mimic2cdb-ps/s20794/s20794.hea).
For cross-sectional studies and all studies involving data mining, it
may be helpful to select a set of subject logs and create a relational
database from them. Instructions for doing this will be posted in
a future revision of this tutorial.
Software for reading and writing logs
Software for converting an annotation log to an HTML log, or to and
from a text log, is available as
a tarball or
as individual files.
Using the MIMIC II Waveform Database
The MIMIC II Waveform Database currently consists of recorded vital signs (such as continuous ECG and blood pressure waveforms) and time series of periodic measurements derived from the vital signs (such as systolic, diastolic, and mean blood pressure, heart rate, and respiration rate) obtained from over 4000 patients. Each MIMIC II Waveform Database record typically covers a patient's entire stay in an intensive care unit (in many cases a week or more).
A bedside monitor receives analog inputs from a variety of transducers attached to each patient in an ICU. During an ICU stay, these transducers are occasionally recalibrated, moved, or replaced, so it is not unusual to find changes in amplitude and discontinuities, as well as the appearance of new signals in the record from time to time. Bedside monitors digitize the analog inputs, analyze them to obtain the periodic measurements, and then relay these data to a central archive that stores them in a proprietary format. The archived data are copied, reformatted in an open (PhysioBank-compatible) format, and deidentified before they are posted as MIMIC II Waveform Database records on PhysioNet.
The WFDB Software Package contains
dozens of applications designed to read,
display, and analyze data in PhysioBank-compatible formats, including MIMIC II
Waveform Database records. These applications are built on the
WFDB library, a set of functions
(subroutines) for reading and writing PhysioBank-compatible files. The
WFDB Software Package is free and open-source, and the WFDB library may be
included in your own software if you wish to write custom applications
(see the WFDB Programmer's Guide for
details). The WFDB Software Package runs on all popular platforms, including
GNU/Linux, Mac OS X, MS Windows, Solaris, and Unix.
Waveform records, numerics records, and alerts
Three types of data are contained in the MIMIC II Waveform database:
- Waveform records
- contain digitized physiologic signals sampled 125 times per second, such as ECGs and continuous blood pressure waveforms. These records are often very large; depending on the number of signals (1-7), the number of bits per sample (8 or 16), and the length of the record (1-100 days), they range from 10 Mbytes to nearly 20 Gbytes (500 Mbytes is typical). Records consist of multiple segments, and the size of individual segments is limited to 2 Gbytes or less, for compatibility with platforms that cannot handle larger files.
- Numerics records
- contain time series of vital signs sampled once per second or once per minute, such as measurements of systolic, mean, and diastolic blood pressure, or heart rate. Usually a dozen or more such time series, all collected simultaneously, comprise a numerics record. Numerics records are stored in the same formats as waveform records, but since the sampling rates are far lower, numerics records are much smaller, and it is not usually necessary for them to be divided into multiple segments.
- Alerts (and other non-periodic data)
- include information about some of the ICU monitor alerts, in some cases supplemented by additional observations collected from other sources. These data are recorded in the same format used for the annotation logs of the MIMIC II Clinical Database. Each annotation is associated with a specific time interval in a waveform or numerics record, and may optionally refer to a specific signal or time series with the record as well. Since monitor alerts may be relevant to the study of either the waveforms or the numerics, copies of the .alarms annotation files containing information about these alerts are linked to both waveform and numerics records.
Waveform records are usually paired with numerics records that have been created simultaneously. It often happens that a waveform record and its accompanying numerics records do not begin and end at the same times, and occasionally it is possible to obtain a numerics record without an acccompanying waveform record, or vice versa.
A record may have multiple annotation files containing independent sets of observations. You can view annotations together with the associated waveforms or numerics using software such as the PhysioBank ATM's "plot waveforms" tool (a viewer that runs in your web browser) or WAVE (a viewer and annotation file editor that runs on your desktop).
Most software designed to read, display, and process PhysioBank data makes an implicit assumption that the same set of signals is recorded at constant gain (amplification) throughout a record, an assumption that allows us to avoid considerable complexity. As noted, this assumption is generally not valid for the data that comprise the waveform records of the MIMIC II Waveform Database. Each record is divided into a set of segments of varying length such that this assumption is valid throughout any given segment, however. Thus software that reads only one segment may assume that the monitor setup is unaltered.
The first segment of each waveform record is a zero-length layout segment. It includes a list of all signals that are present in any segment of the record, and specifies a standard gain for each signal. Software that uses the WFDB library to open a complete waveform record, beginning with its layout segment, will "see" a continuous record, seamlessly reconstructed from the concatenated segments, with sample values rescaled to match the standard gain for each signal, and discontinuities filled in with a special value (-32768) that indicates that a sample is missing. Thus, even when reading an entire record, it is still possible to assume that the monitor setup is unaltered.
The PhysioBank ATM's record maps (such as the one below) provide compact
views of records that make it easy to locate intervals containing specific
signals or combinations of them.

This example shows, schematically, the entire length (almost 4 days) of MIMIC II Waveform Database record a40006. The red bars indicate when ECG signals were recorded, and the blue bars indicate the blood pressure signals. Below the signals, the density of the annotations in the alarm set is represented by the grey histogram; this record doesn't have an alM set of annotations, so no indicators appear on the corresponding bar. When viewing a record map in the ATM, you can select a region (for viewing in detail, downloading, or other functions) by clicking on the navigation area above the map.
In the first group of 2769 records, 2630 were obtained from 2320 subjects who are also represented in the MIMIC II Clinical Database. About 11% of these 2320 subjects were admitted to an ICU more than once during the inital study period and are thus represented by two or more MIMIC II Waveform Database records in the first group. These records include up to four simultaneous signals (125 eight-bit samples/second each) and (typically) ten or more derived measurements recorded once per minute. Records obtained after the first group (roughly 2000 additional patient records to date) include up to seven simultaneous signals (125 ten-bit samples/second each) and ten or more derived measurements recorded once per second.
The MIMIC II Waveform Database file named RECORDS is a text file containing a complete list of the available MIMIC II Waveform Database records. Each record is stored in its own subdirectory of the MIMIC II Database home directory. This arrangement is reflected in RECORDS, which begins:
a40001/a40001
a40002/a40002
a40003/a40003
a40004/a40004
a40005/a40005
Downloading
If your software uses the WFDB library to read these records, it is not necessary to download them, since the WFDB library can act as an HTTP client to read their contents directly from the PhysioNet web server. It is not necessary to read an entire record, or even an entire segment of a record, in order to read the data in any arbitrary region of interest; since MIMIC II Waveform Database records can be tens or hundreds of megabytes in length, you may save considerable time by reading only the regions of interest as needed.
If you decide to download entire records anyway, it will be easiest to use the PhysioBank ATM to obtain a tarball or zip archive of each record of interest. We strongly recommend creating a mimic2db subdirectory within some directory in your WFDB path and then unpacking the downloaded tarballs or zip archives within it, thereby creating a subdirectory of mimic2db for each record, as on the PhysioNet web server. If you do so, the examples below will work as shown for any record in the MIMIC II Waveform Database; if a local copy of a record is available, it will be read, and if not, the copy on the PhysioNet web server will be read.
The PhysioBank ATM offers several other possibilities for
downloading records. If you have software that can read EDF (European
Data Format), you can download an EDF file of an entire record. If
you are using Matlab or Octave, you can download a .mat file
of any one signal, or of all signals, containing up to a million
samples per signal (about 2 hours and 20 minutes of a waveform record,
or, in most cases, an entire numerics record). Longer
.mat files can be produced by downloading a tarball or zip
archive, unpacking it, and converting the files using
wfdb2mat from the WFDB software
package. The ATM can also help you to read samples and annotations as
text, discussed in the next section.
Reading samples as text
It may be useful to view or save an excerpt of a record in text form, which can be done easily following the methods described here. For example, to read the first 10 samples of each signal in record a40004/a40004, use the command:
rdsamp -r mimic2db/a40004/a40004 -t s10 -p -vwhich produces this output:
time	II	III	AVL	AVF	ABP	PAP
(sec)	(mV)	(mV)	(mV)	(mV)	(mmHg)	(mmHg)
  0.000	  0.176	      -	      -	  1.000	109.600	      -
  0.008	  0.112	      -	      -	  1.011	106.400	      -
  0.016	  0.056	      -	      -	  1.021	103.200	      -
  0.024	  0.008	      -	      -	  1.032	100.000	      -
  0.032	 -0.024	      -	      -	  1.043	 96.800	      -
  0.040	 -0.048	      -	      -	  1.053	 92.800	      -
  0.048	 -0.064	      -	      -	  1.064	 89.600	      -
  0.056	 -0.072	      -	      -	  1.074	 86.400	      -
  0.064	 -0.080	      -	      -	  1.085	 83.200	      -
  0.072	 -0.080	      -	      -	  1.096	 80.000	      -
The command-line option '-r mimic2db/a40004/a40004' specifies the desired record within the MIMIC II Database (mimic2db). See rdsamp's man page within the WFDB Applications Guide for a description of all of rdsamp's command-line options.
The first line of output above shows that there are 4 ECG leads (II, III, AVL, and AVF) and two blood pressure signals (ABP and PAP) available at various times during this record. Not all of them are available simultaneously, however, and at the beginning of this record, only ECG leads II and AVF, and ABP (blood pressure measured in the radial artery) were recorded.
Since the records begin almost immediately upon the patient's admission into the ICU, often while the monitor leads are still being connected, it is frequently the case that the first few segments of a record are short and that no signals (or few signals) are visible initially.
The individual segments within each waveform record have record names of their own, such as a40001/a40001_000000, a40001/a40001_000001, etc., and can be read in the same way as the complete (multi-segment) records, as in this example:
rdsamp -r mimic2db/a40004/a40004_000000 -t s10 -p -vwhich produces this output:
time	II	ABP	AVF
(sec)	(mV)	(mmHg)	(mV)
  0.000	  0.176	109.600	  1.000
  0.008	  0.112	106.400	  1.011
  0.016	  0.056	103.200	  1.021
  0.024	  0.008	100.000	  1.032
  0.032	 -0.024	 96.800	  1.043
  0.040	 -0.048	 92.800	  1.053
  0.048	 -0.064	 89.600	  1.064
  0.056	 -0.072	 86.400	  1.074
  0.064	 -0.080	 83.200	  1.085
  0.072	 -0.080	 80.000	  1.096
Notice that the signals that were unavailable in the first example are not even listed in this case, because those signals are not available within the specific (single-segment) record.
The time series of derived measurements recorded once per minute (for the first group of records) or once per second (for all later records) are stored as a separate single-segment record within the same directory as the associated waveform record. The name of the record containing the derived measurements is the same as that of the waveform record, but with an appended 'n'; thus the record of derived measurements associated with a40004/a40004 is named a40004/a40004n, and the measurements acquired over a 15-minute period beginning 25 hours into the record can be read by the command:
rdsamp -r mimic2db/a40004/a40004n -f 25:0:0 -t 25:15:0 -ph -vwhich produces this output:
time	HR	ABPSys	ABPDias	ABPMean	PAPSys	PAPDias	PAPMean	CVP	PULSE	RESP	SpO2	NBPSys	NBPDias	NBPMean	CO
(hrs)	(bpm)	(mmHg)	(mmHg)	(mmHg)	(mmHg)	(mmHg)	(mmHg)	(mmHg)	(bpm)	(pm)	(%)	(mmHg)	(mmHg)	(mmHg)	(Lpm)
 25.000	100.000	109.100	 65.700	 82.500	 29.300	 16.400	 22.000	 15.300	100.100	  6.900	 99.000	      -	      -	      -	  0.000
 25.017	100.200	101.500	 61.900	 77.200	 27.700	 15.600	 21.100	  8.300	100.300	  0.000	 99.000	      -	      -	      -	  0.000
 25.033	100.000	 97.900	 59.900	 74.700	 27.200	 15.800	 21.000	  8.100	 99.800	  7.800	 99.000	      -	      -	      -	  0.000
 25.050	 99.700	 95.900	 59.000	 73.300	 26.600	 15.300	 20.400	  8.000	 99.500	 11.700	 99.100	      -	      -	      -	  0.000
 25.067	 99.700	 94.200	 58.300	 72.100	 26.100	 15.400	 20.300	  8.100	 99.400	  9.000	 99.100	      -	      -	      -	  0.000
 25.083	 99.100	 93.200	 56.400	 71.000	 26.800	 14.800	 20.100	  8.100	 99.300	  7.700	 99.000	      -	      -	      -	  0.000
 25.100	 99.000	 94.000	 56.000	 71.000	 35.000	  9.000	 19.000	  9.000	 98.000	  6.000	 99.000	      -	      -	      -	  0.000
 25.117	 97.700	 94.500	 57.000	 71.200	  0.000	  0.000	 20.400	 10.200	 99.100	  5.300	 99.000	      -	      -	      -	  0.000
 25.133	 97.200	 96.300	 57.400	 72.000	 31.400	 16.900	 20.700	226.700	 96.800	  6.000	 99.000	      -	      -	      -	  0.000
 25.150	 96.700	 96.900	 58.000	 72.200	 34.100	 18.200	 20.000	295.700	 96.100	 15.000	100.000	      -	      -	      -	  0.000
 25.167	 96.200	 97.800	 58.500	 72.700	  0.000	  0.000	 20.200	297.500	 96.400	 13.300	100.000	      -	      -	      -	  0.000
 25.183	 96.200	 96.700	 57.900	 71.900	 26.400	 15.000	 20.400	298.100	 96.200	 13.300	100.000	      -	      -	      -	  0.000
 25.200	 95.400	 97.500	 58.100	 72.200	 27.100	 15.400	 20.800	296.200	 95.400	 13.000	100.000	      -	      -	      -	  0.000
 25.217	 95.400	 97.700	 57.800	 72.000	 26.800	 15.400	 21.000	 16.200	 94.800	 12.900	100.000	      -	      -	      -	  8.280
 25.233	 94.900	 98.100	 58.200	 72.300	 26.400	 15.200	 20.700	  8.000	 94.700	 13.000	100.000	      -	      -	      -	  0.000
Note that the noninvasive blood pressure (NBP) measurements are missing during this period, and that there is a single cardiac output (CO) measurement at 25.217 hours. Since the CO measurement is obtained by thermodilution, no values are available except at varying intervals when a test is performed; the instrument that measures CO reports zero at other times. Occasional zeroes and other anomalously low values also appear in some of the other columns, including respiration rate (RESP) and pulmonary arterial pressure (PAP); anomalously high values are recorded for central venous pressure (CVP) during a 5-6 minute interval. These non-physiologic values can be recognized readily in this case, but in other cases it may be necessary to refer to the (higher resolution) waveform records to determine if an observed change is artifactual or physiologic.
You can obtain outputs such as those shown above using the PhysioBank ATM
from your web browser.
By naming the signal(s) of interest
following rsamp's -s
options, the volume of output can be reduced considerably, as in this
example using numerics record 40006n:
Selecting one or more signals
rdsamp -r mimic2db/a40006/a40006n -ph -s CO
which produces output that begins
  0.000	  0.000
  0.017	  0.000
  0.033	  0.000
  0.050	  0.000
  0.067	  0.000
  0.083	  0.000
  0.100	  0.000
The standard grep utility can suppress the uninteresting
lines:
rdsamp -r mimic2db/a40006/a40006n -ph -s CO | grep -v 0.000
yielding:
  1.567	  5.650
  3.633	  4.500
  9.017	  4.610
 11.883	  4.300
 17.883	  4.510
 24.000	  5.000
 27.567	  4.640
 34.100	  4.680
 40.817	  4.290
Plotting signals and time series
As a final example, we can combine rdsamp with plt like this:
rdsamp -r mimic2db/a40006/a40006n -ph -s CO | \
 plt 0 1 -t "CO vs. time" -x "Elapsed time (hours)" -y "CO (liters/minute)"
to produce a plot like this (click on the image for a larger view):
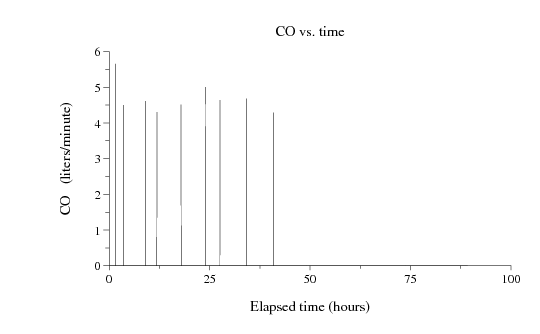
See the plt Tutorial and Cookbook for examples and details on plotting using plt.
Linking Clinical and Waveform Records
A pair of tables is provided so that records in the MIMIC II Clinical Database can be matched with those in the MIMIC II Waveform Database. To find waveform records corresponding to clinical records, refer to the clinical database map, and to find clinical records corresponding to waveform records, refer to the waveform database map. Both maps include the gender and age of each patient, and a concise statistical summary of the patient population represented in the databases.