To test these possibilities, we first measured the stride interval in healthy young adult men as they walked continuously on level ground at their self-determined, usual rate for about nine minutes [15]. To measure the stride interval in health and disease, ultra-thin, force sensitive switches were placed inside the shoe. We recorded the footswitch force on an ambulatory recorder and then determined heelstrike timing [34]. This recently devised, inexpensive and portable technique enables, for the first time, continuous and relatively long-term measurement of gait, and is roughly analogous to the use of Holter monitoring for recording continuous heartbeat activity.
A representative stride interval time series from a healthy subject is
shown in Fig. 9 (top). Of note is the stability of the
stride interval; during a nine-minute walk, the coefficient of
variation is only 4%. Thus, as in Fig. 8, a
reasonable first approximation of the dynamics of the stride interval
would be a constant. Nonetheless, the stride interval, like the
healthy heartbeat, does vary irregularly, raising the intriguing
possibility of some underlying complex temporal ``structure.''
Further, this complicated pattern changes after random shuffling of
the data points (Fig. 9), demonstrating that the
original temporal pattern is related to the sequential ordering of the
stride intervals, and is not simply a result of the distribution of
the data points. Fig. 9 (bottom left) shows the DFA
plots for the original time series and the shuffled time series. The
slope of the line relating log F(n) to log n is .83 for the original
time series and .50 after random shuffling. Thus, fluctuations in the
stride interval scale as ![]() indicating
long-range correlations, while the shuffled data set behaves as
uncorrelated (white) noise;
indicating
long-range correlations, while the shuffled data set behaves as
uncorrelated (white) noise; ![]() = .50. Fig. 9
(bottom right) displays the power spectrum of the original time
series. The spectrum is broadband and scales as
= .50. Fig. 9
(bottom right) displays the power spectrum of the original time
series. The spectrum is broadband and scales as ![]() with
with
![]()
![]() .92. The two scaling exponents are consistent with
each other within statistical error due to finite data length
[35], and both
.92. The two scaling exponents are consistent with
each other within statistical error due to finite data length
[35], and both ![]() and
and ![]() are consistent with
long-range (fractal) correlations (compare with Fig. 5.
are consistent with
long-range (fractal) correlations (compare with Fig. 5.
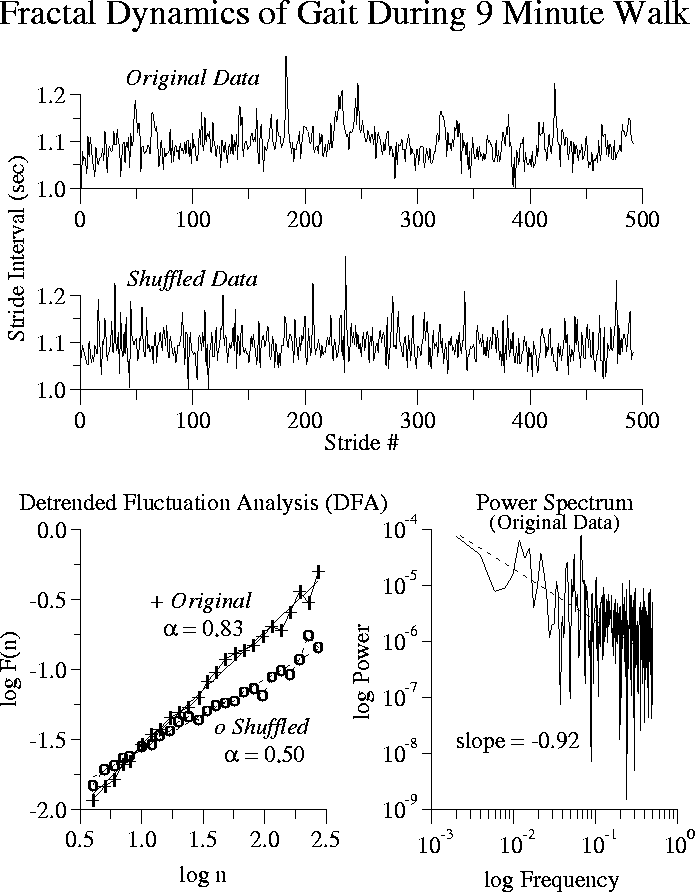
Figure: Representative stride interval time series before and
after random shuffling of the data points (above) and the detrended fluctuation
analysis (DFA) and power spectrum analysis (below).
The structure in the original time series disappears after
random shuffling of the data. DFA indicates that this structure
represents a fractal process with long-range correlations (![]() = .83).
Adapted from [15].
= .83).
Adapted from [15].
For a group of ten healthy adults, we confirmed that the scaling exponents
![]() and
and ![]() both indicated the presence of long-range
correlations consistent with a fractal gait rhythm. After random shuffling of the original stride interval time
series,
both indicated the presence of long-range
correlations consistent with a fractal gait rhythm. After random shuffling of the original stride interval time
series, ![]() approaches the value of a completely uncorrelated
process (.50). The shuffled time series has the same mean and standard deviation as the original time series, indicating that this fractal property of healthy human gait is related to the sequential ordering of the stride interval time
series, but not to the first or second moments of the time series.
approaches the value of a completely uncorrelated
process (.50). The shuffled time series has the same mean and standard deviation as the original time series, indicating that this fractal property of healthy human gait is related to the sequential ordering of the stride interval time
series, but not to the first or second moments of the time series.