Figure:
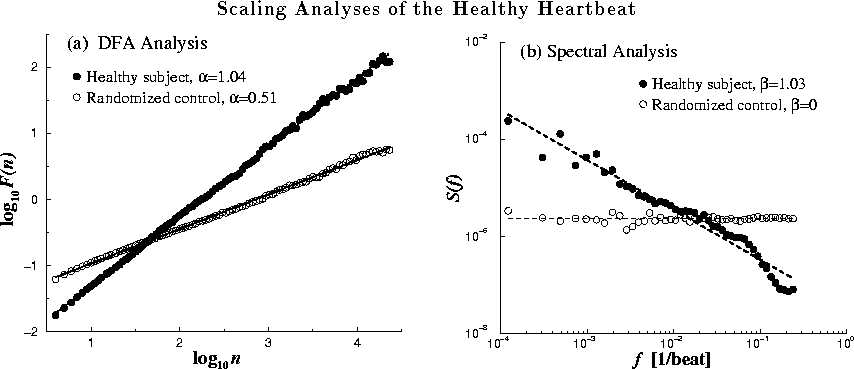
Scaling analyses for two 24-hour interbeat interval time series are shown
in Fig. 3. The solid circles represent data from a healthy
subject, while the open circles are for the artificial time series
generated by randomizing the sequential order of data points in the
original time series. (a) Plot of ![]() vs
vs ![]() by the DFA
analysis. (b) Fourier power spectrum analysis. The spectra have been
smoothed (binned) to reduce scatter.
by the DFA
analysis. (b) Fourier power spectrum analysis. The spectra have been
smoothed (binned) to reduce scatter.
To test whether heartbeat time series exhibit fractal behavior, we can apply
the DFA algorithm to the full, 24-hour data sets excerpted in Fig. 3. Figure 5 compares the DFA analysis of the interbeat interval time series for the healthy subject with the randomized control time series. For the healthy subject, DFA analysis shows
scaling behavior with exponent ![]() over 3 decades, consistent
with 1/f-type of dynamics as previously reported
[20, 21]. As expected, the randomized
control data set shows a trivial exponent
over 3 decades, consistent
with 1/f-type of dynamics as previously reported
[20, 21]. As expected, the randomized
control data set shows a trivial exponent ![]() ,
indicating uncorrelated randomness. Power spectrum analysis confirms
the DFA results. The
,
indicating uncorrelated randomness. Power spectrum analysis confirms
the DFA results. The ![]() exponent derived from
the power spectrum, however, is less accurate because the stationarity
requirement for Fourier analysis is not satisfied in this case.
exponent derived from
the power spectrum, however, is less accurate because the stationarity
requirement for Fourier analysis is not satisfied in this case.