The lumped parameter model of the intact pulsatile heart and
circulation is illustrated in Figure 1 in terms of its
electrical circuit analog. Here, charge is analogous to blood volume
(![]() , ml), current, to blood flow rate (
, ml), current, to blood flow rate (![]() , ml/s), and voltage,
to pressure (
, ml/s), and voltage,
to pressure (![]() , mmHg). The model consists of six compartments which
represent the left and right ventricles (
, mmHg). The model consists of six compartments which
represent the left and right ventricles (![]() ), systemic arteries
and veins (
), systemic arteries
and veins (![]() ), and pulmonary arteries and veins (
), and pulmonary arteries and veins (![]() ). Each
compartment consists of a conduit for viscous blood flow with
resistance (
). Each
compartment consists of a conduit for viscous blood flow with
resistance (![]() ) and a volume storage element with compliance (
) and a volume storage element with compliance (![]() )
and unstressed volume (
)
and unstressed volume (![]() ). Two of the resistances and two of the
compliances are nonlinear. The systemic venous resistance is
represented by a Starling resistor (with chamber pressure set to
atmospheric pressure), while the pulmonary arterial resistance is
represented by an infinite number of parallel Starling resistors (with
chamber pressure equal to alveolar (
). Two of the resistances and two of the
compliances are nonlinear. The systemic venous resistance is
represented by a Starling resistor (with chamber pressure set to
atmospheric pressure), while the pulmonary arterial resistance is
represented by an infinite number of parallel Starling resistors (with
chamber pressure equal to alveolar (![]() ) pressure), arranged
vertically, one on top of the other. The pressure-volume
relationships of the left and right ventricles consist of an
essentially linear regime (characterized by compliance and unstressed
volume), a diastolic volume limit (
) pressure), arranged
vertically, one on top of the other. The pressure-volume
relationships of the left and right ventricles consist of an
essentially linear regime (characterized by compliance and unstressed
volume), a diastolic volume limit (![]() ), and a systolic pressure
limit (
), and a systolic pressure
limit (![]() ). The compliances of the linear regime of the
ventricular pressure-volume relationship vary periodically over time
(time evolution is precisely determined by the end-diastolic
compliance (
). The compliances of the linear regime of the
ventricular pressure-volume relationship vary periodically over time
(time evolution is precisely determined by the end-diastolic
compliance (![]() ), the end-systolic (
), the end-systolic (![]() ) compliance, and the heart
rate (
) compliance, and the heart
rate (![]() )) and are responsible for driving the flow of blood. The
four ideal diodes represent the ventricular inflow and outflow valves
and ensure uni-directional blood flow. Finally, the reference
pressure is set to intrathoracic (
)) and are responsible for driving the flow of blood. The
four ideal diodes represent the ventricular inflow and outflow valves
and ensure uni-directional blood flow. Finally, the reference
pressure is set to intrathoracic (![]() ) pressure for the ventricular
and pulmonary compartments.
) pressure for the ventricular
and pulmonary compartments.
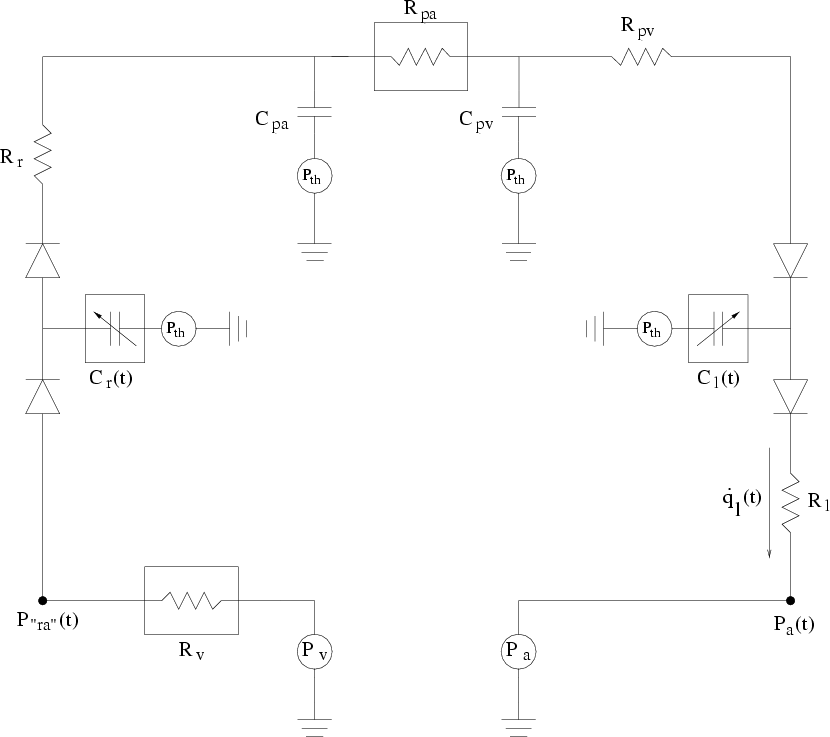 |
Figure 2 illustrates the electrical circuit analog of the
lumped parameter model of the human heart-lung unit preparation. The
input pressure to the heart-lung unit here is defined to be the node
labelled
![]() - the location of where the right
atrium would be if it were explicitly included in the model. Cardiac
function curves may be obtained from this preparation by varying the
independent voltage sources,
- the location of where the right
atrium would be if it were explicitly included in the model. Cardiac
function curves may be obtained from this preparation by varying the
independent voltage sources, ![]() and
and ![]() , and time-averaging the
resulting
, and time-averaging the
resulting
![]() and
and
![]() .
.
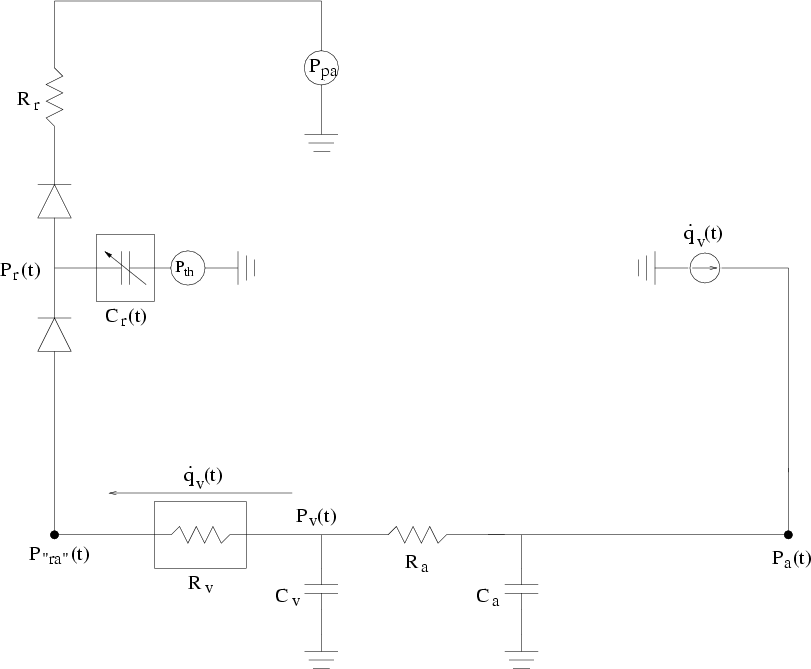
Figure 3 illustrates the electrical circuit analog of the
lumped parameter model of the human systemic circulation preparation.
Venous return curves may be measured from this preparation by
adjusting the value of ![]() at end-diastole (
at end-diastole (![]() ) in order
to vary
) in order
to vary
![]() - the pressure that impedes flow
into the right ventricle - and time-averaging the resulting
- the pressure that impedes flow
into the right ventricle - and time-averaging the resulting
![]() and
and
![]() . Note that the
independent current source here (
. Note that the
independent current source here (
![]() ) keeps the mean
systemic (
) keeps the mean
systemic (![]() ) pressure precisely constant throughout the measurement
period by pumping into the systemic circulation whatever is pumped
out.
) pressure precisely constant throughout the measurement
period by pumping into the systemic circulation whatever is pumped
out.
 |