Next: Analysis example: Measuring ST deviations Up: Analyzing Data with WAVE Previous: Using the Log window
To open the Scope window, first open the Analyze window,
then click left on
![]() .
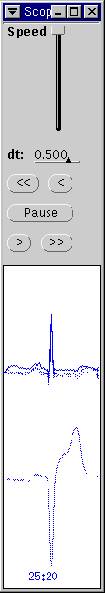
The Scope window simulates an oscilloscope by using color map
animation (on hardware with an X server that supports this technique)
or stipple masks (otherwise). The display is ``triggered'' by beat
(QRS) annotations (other annotations, such as rhythm changes, are
ignored). As each waveform is drawn, the previously drawn waveform is
made to fade progressively into the background, disappearing
completely after four new waveforms have been drawn. The appearance
is similar to that of an analog scope with moderately long-persistence
phosphor. The x-position in the window of the trigger point (the
sample that the annotation points to for each waveform) is adjustable
using the dt: setting (the value is expressed in seconds, and
may be negative). It is also possible to resize the window, so that
several waveforms can be viewed side-by-side as well as superimposed.
As shown in the figure at left, WAVE shifts waveforms to the bottom
of the window if they have been annotated as ventricular ectopic
beats. (This behavior was chosen to be most useful for studying ECGs,
but other signals can be annotated in the same way if desired.)
.
The Scope window simulates an oscilloscope by using color map
animation (on hardware with an X server that supports this technique)
or stipple masks (otherwise). The display is ``triggered'' by beat
(QRS) annotations (other annotations, such as rhythm changes, are
ignored). As each waveform is drawn, the previously drawn waveform is
made to fade progressively into the background, disappearing
completely after four new waveforms have been drawn. The appearance
is similar to that of an analog scope with moderately long-persistence
phosphor. The x-position in the window of the trigger point (the
sample that the annotation points to for each waveform) is adjustable
using the dt: setting (the value is expressed in seconds, and
may be negative). It is also possible to resize the window, so that
several waveforms can be viewed side-by-side as well as superimposed.
As shown in the figure at left, WAVE shifts waveforms to the bottom
of the window if they have been annotated as ventricular ectopic
beats. (This behavior was chosen to be most useful for studying ECGs,
but other signals can be annotated in the same way if desired.)
The navigation controls are similar to those in the Log window.
![]() and
and
![]() may be used to move backward and
forward through the record one beat at a time.
may be used to move backward and
forward through the record one beat at a time.
![]() and
and
![]() provide a continuous ``movie'' (at a speed controlled
by the Speed slider) that can be interrupted by
provide a continuous ``movie'' (at a speed controlled
by the Speed slider) that can be interrupted by
![]() ,
which also recenters the signal window on the current beat. Whenever
the current beat is visible in the signal window, it is marked with
the selection rectangle.
,
which also recenters the signal window on the current beat. Whenever
the current beat is visible in the signal window, it is marked with
the selection rectangle.
Only one signal at a time can be displayed in the Scope window.
Select that signal using the Signal field in the Analyze
window, or press and hold the
![]() key while clicking left
in the signal window near the desired signal.
key while clicking left
in the signal window near the desired signal.