Next: Loading annotations to be edited Up: WAVE User's Guide Previous: A Five-Minute Tour of WAVE
There are five editing operations that you can perform using WAVE : changing, moving, copying, inserting, and deleting annotations. In this chapter, you will create and edit an annotation file using WAVE and an external QRS detection program. Start as in the previous chapter, but use the command
wave -r 100s &
omitting the `-a atr' option this time. Note that the title bar
contains only the record name.
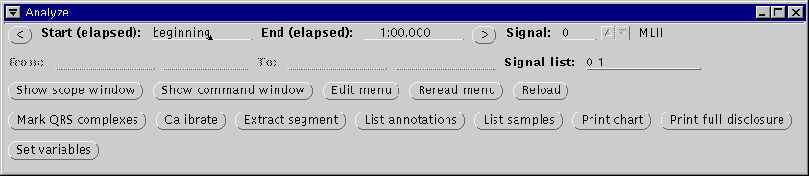
Below the title bar of the Analyze window, text fields allow you to specify the beginning and end of a segment of the record, and to choose signals. The Analyze window also contains buttons specifying various actions that you can apply to the signals. The separate Analysis Commands window behaves like an OpenWindows cmdtool window (a scrollable terminal emulator).
Commands may be run in the Analysis Commands window either by clicking left on action buttons in the Analyze window, or by typing directly into the window (depending on your window manager's policy for moving the keyboard focus, you may need to click left within the window before you can type into it, however). The Analysis Commands window may be resized if desired, and standard Open Look user interface methods may be used to cut and paste text between it and other windows, including those in other applications.
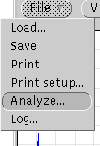
To create an annotation file, click left on
![]() .
The command
.
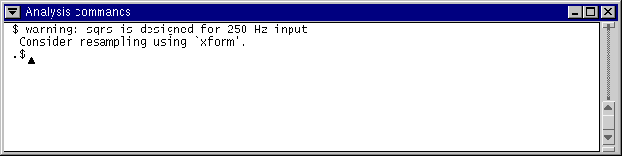
The command
sqrs -r 100s -f 0 -t 1:00.000 -s 0
appears in the Analysis Commands window, as shown in
figure 2.2. Below the command, its error
output appears. When the command has run to completion (which will take only
a few seconds unless the WAVE host is heavily loaded), an annotation file
named `100s.qrs' is written into the current directory.
If you wish, the Analyze window or the Analysis Commands
window, or both, may be dismissed (by selecting Quit from the
window menu to the left of the title bar); this can be done at any
time, even while analysis is still in progress. If you recall the
Analysis Commands window later (using
![]() in the Analyze window), it will show any output sent to it
while it was dismissed. Note that the Analysis Commands window is
dismissed whenever you exit from WAVE , and its contents are not
retained after that point.
in the Analyze window), it will show any output sent to it
while it was dismissed. Note that the Analysis Commands window is
dismissed whenever you exit from WAVE , and its contents are not
retained after that point.