With the cooperation and assistance of the manufacturer, we developed special-purpose software (available on request from the authors) for logging the signals acquired by the Hewlett Packard CMS (``Merlin'') bedside monitors in the medical, surgical, and cardiac ICUs of Boston's Beth Israel Hospital. The process requires the use of a pair of optional interface cards in the bedside monitor, communicating over two serial links at 38400 baud with a standard PC equipped with a Digiboard PC/4e ``smart'' serial interface, running our software. This configuration allows us to record three ECG signals each sampled at 500 Hz, and four or five other signals each sampled at 125 Hz (or two ECG signals and six other signals), in addition to the monitor's periodic measurements, alarms, and monitor status messages. These limits are determined by the amount of data that can be passed through the two serial links at the maximum speed; in almost all cases, they permit us to log all of the signals available to the monitor, and all of its outputs. (We are not limited to the subset of signals displayed on the monitor's screen; if additional signals are available, they can be logged even if they are not displayed.) Although we initially planned to record for 24 hour periods, the data logging PCs proved to be so reliable that we have been able to record for 48 hours routinely, and in some cases as much as 80 hours per record. (We limit the total amount of data logged to about 600 Mb per record, so that each record can be stored on a single CD-ROM.)
To limit possible loss of data from power interruptions, the continuous recording is written in ten-minute segments, which are stored during logging on disk and copied to tape automatically at the conclusion of the logging process. Our software permits these segments to be read later as individual records or as a single continuous record without gaps between segments. In principle, this facility could permit us to produce seamless records that span multiple CD-ROMs.
At the beginning of each logging session, we record a sample of the monitor's calibration pulses. When reviewing the recordings, we use these pulses to correct for inter-signal sampling skew between the ECG signals. (Uncorrected skews of 16 or 32 ms may remain between the other signals, due to limitations in the monitor design). The signals are calibrated, and the record is copied to CD-R media for archival storage.
We attempt to capture all of the patient data available to the ICU
staff during the recording period, so that the recording can serve as
a high-fidelity patient simulation for development and evaluation of
intelligent monitors. Our protocol is designed to be minimally
disruptive to the normal monitoring procedure, so we do not require
that specific signals be recorded; hence the MIMIC Database contains a
variety of signal sets representative of standard practice in the ICUs
at the Beth Israel Hospital. The records contain two or three ECG
signals, and any other available signals, usually including arterial
blood pressure, respiration, and pulse oximeter signal (a
pulsatile signal used by the bedside monitor to derive measurements of
oxygen saturation). The monitor's measurements of slowly-changing
variables are recorded at intervals of 1.024 seconds (though some of
these measurements are updated less frequently). These typically
include heart and respiration rates, oxygen saturation, and systolic,
diastolic, and mean arterial and pulmonary arterial blood pressures;
frequently other measurements, such as blood temperature, inspired minimum and
end-tidal CO ![]() , fractional inspired O
, fractional inspired O ![]() , and cardiac output,
are also available.
, and cardiac output,
are also available.
For each record, clinical data derived from the patient's medical records (including symptoms, diagnoses, progress notes, and medications administered) and from the hospital's clinical computing systems (primarily laboratory results) are also included in the MIMIC Database. The available on-line data are downloaded into a relational database, and additional data abstracted from the paper medical record are hand-entered into another relational database. These databases are provided on the MIMIC Database CD-ROMs, and are also used to create an annotation file for each record that provides a timeline for simulations or case studies. Thus, for example, it is possible using our WAVE software [1] (see figure 1) to review the record in a fashion that allows ``discovery'' of events, laboratory results, and other findings in chronologic order.
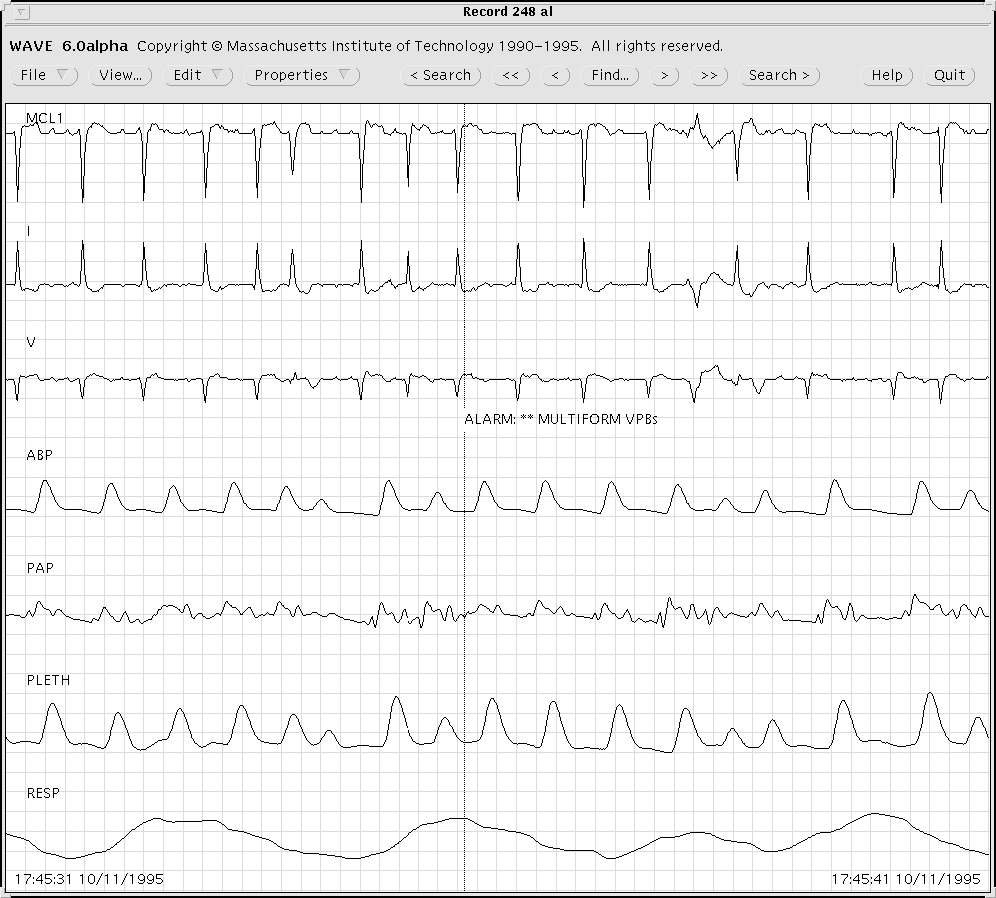
Figure 1: A sample of MIMIC Database record 248, as it appears when
viewed using WAVE. Note the annotation at the center,
indicating that the monitor issued an alarm for multiform PVCs (the
beats that triggered the alarm occurred several seconds earlier; the
marker indicates the time when the alarm was issued).
For certain studies, the time series of the monitor's measurements may be sufficient. In addition to a presentation of these measurements together with the digitized signals, we have also prepared collections of these time series presented as signals for analysis by standard signal-processing software (see figure 2).
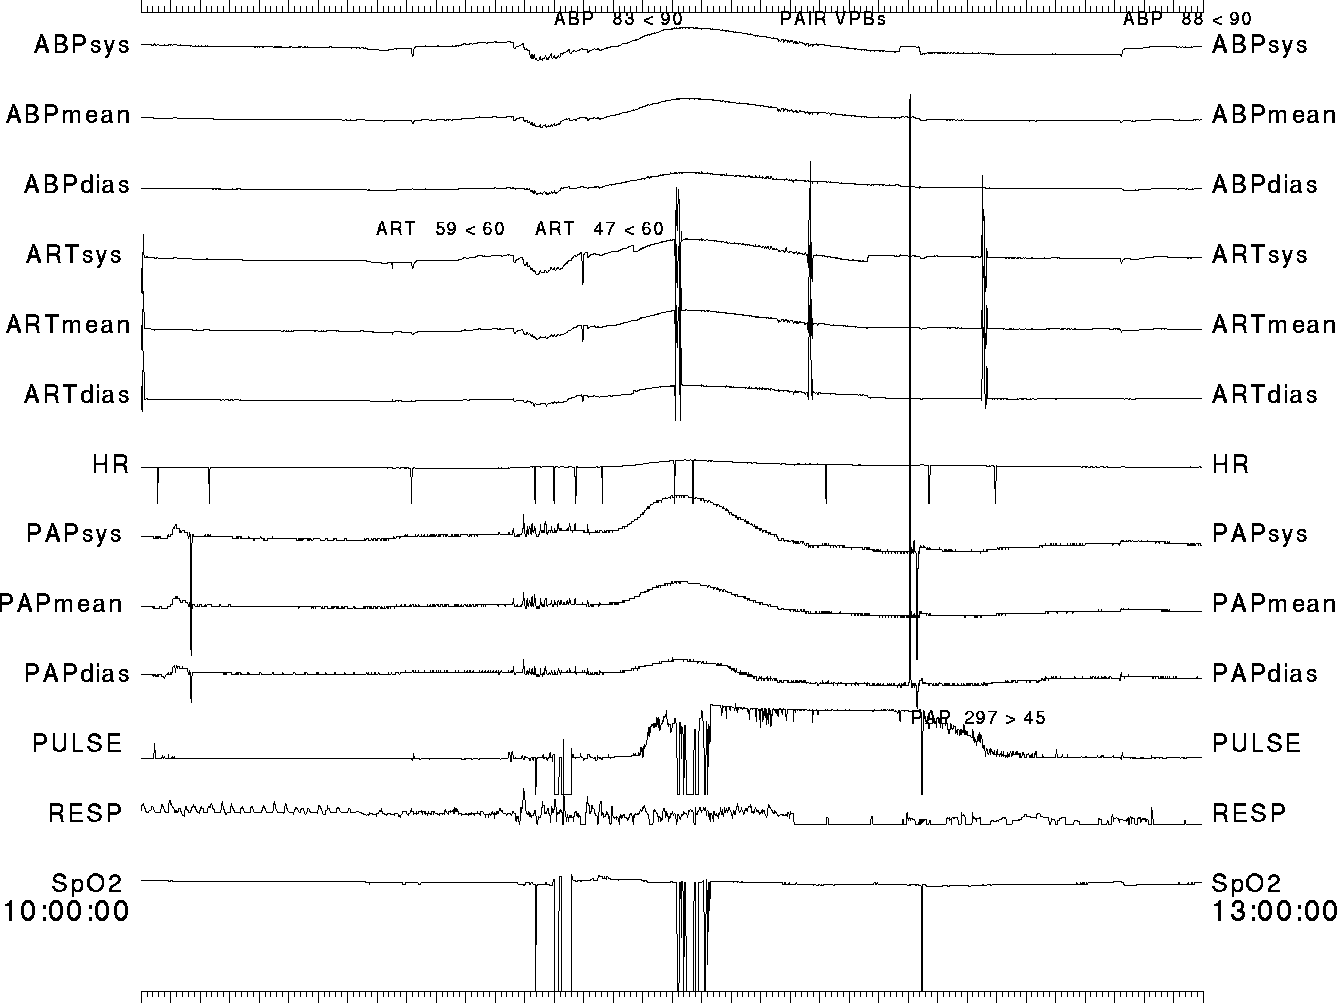
Figure 2: A three-hour excerpt of the time series of monitor
measurements for MIMIC Database record 216. Note the monitor's alarms
(recorded as annotations, shown above the associated time series)
surrounding the blood pressure changes that occur beginning at about
11:00:00.
Since these data require approximately two orders of magnitude less storage than the original signals, a complete collection of them for the entire MIMIC database, representing about 6000 hours of data, can fit on a single CD-ROM. This format is particularly convenient for studies that involve post-processing of the monitor measurements, as illustrated in figures 3 and 4.
Study of the simultaneous changes in several physiological variables will often illuminate the underlying physiology, and may be helpful in detecting artifactual data. For example, the scatter plot in the upper left panel of figure 3 demonstrates that changes in mean ABP and diastolic PAP are often correlated. This is to be expected in the context of normal myocardial function, where preload and afterload tend to move in the same direction. When these pressures are anti-correlated, one suspects changes in myocardial contractility as the cause (see fig.4). In the complete absence of correlations between the two pressures, one suspects the possibility of artifactual data. For example, the spike in PAP near 20 hours in the lower panels of figure 3 is not accompanied by changes in ABP, and examination of the raw signals confirms that the monitor alarms for that event were erroneous due to artifact.