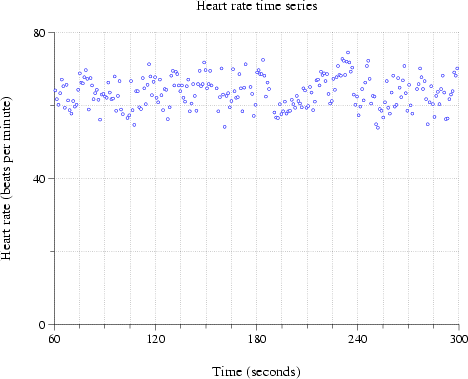
We conclude this tutorial by adding a transient fontgroup specification (see chapter 11) that has the effect of modifying the appearance of the scatter plot symbols. To do this, we append ``(P/2,Cblue)'' to the argument of the -p option, like this:
plt heartrate.data -t "Heart rate time series" \
  -x "Time (seconds)" -y "Heart rate (beats per minute)" \
  -xa 60 300 15 - 4 0 -ya 0 80 20 -g grid,sub \
  -p "0,1Scircle(P/2,Cblue)"
(Since the shell (command interpreter) normally treats parentheses as special characters, it is necessary to enclose the entire argument of -p in quotation marks, in order to pass it as shown to plt without shell interpretation.)
Fontgroup modifications provide an extremely powerful and flexible way to control the appearance of a plot. In this example, ``P/2'' reduces the size of the circles by a factor of 2, and ``Cblue'' causes them to be drawn in blue. (A complete list of color names is included in appendix A.)