plt -h | more
If the -h option is followed by one or more strings (which should not begin with hyphens), plt prints one-line summaries of all options beginning with those strings only.
As an alternative to supplying options and their arguments on the command line, you may write them into a format file that can be read by plt. This facility is particularly useful when you create a series of complex plots using some or all of the same options. You can put some of your options in a format file and supply others on the command line. Within a format file, omit the initial hyphen (-) from each option name. To use a format file, supply the option -f followed by the name of the format file, as in:
plt data-file 0 1 -f format-file
A third way to pass options to plt is within a quoted format
string, following the -F option. Use the same syntax in a
format string as in a format file.
For examples of -f and -F, compare
figures 5.2 and 6.1 on
pages ![[*]](crossref.png) and .
and .
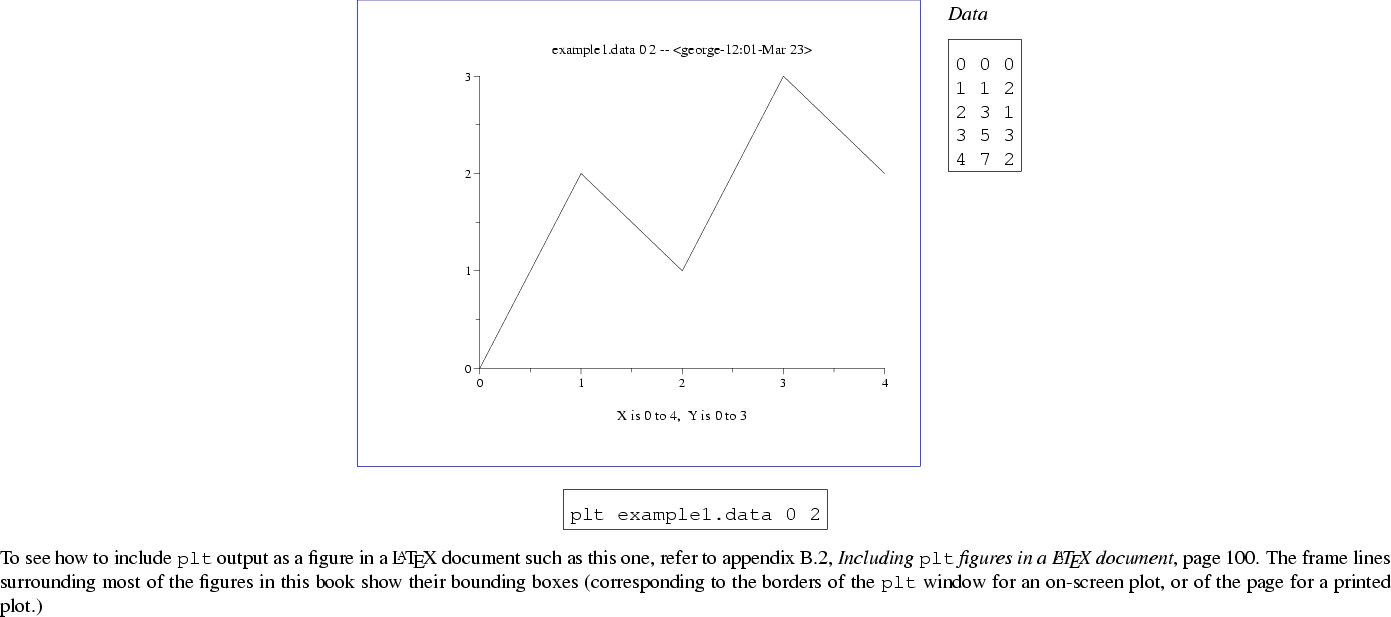
Let's see how a simple plot can be created, using example1.data. If we would like the first column to be the set of x coordinates and the third column to be the set of y coordinates, we can type:
plt example1.data 0 2and our plot would look like figure 2.1.
Notice that in the command line, the argument ``0'' corresponds to the first column of example1.data, and the argument ``2'' to the third column. Column 0 becomes the x axis; column 2 becomes the y axis. Likewise, the argument ``1'' in either of these two positions would correspond to column 1 (the second column) of example1.data, and would become either the x or the y axis depending upon its position.
plt can produce both screen and printed plots. If you try the examples exactly as shown in the main part of this book, you will obtain screen plots. Although you can use other software to make and print screen dumps of these plots, this is neither the best nor the easiest way to print your plots on paper. The following sections show how you can obtain publication-quality plots on PostScript or other types of printers, with only minor changes to the plt commands needed to make the corresponding screen plots.