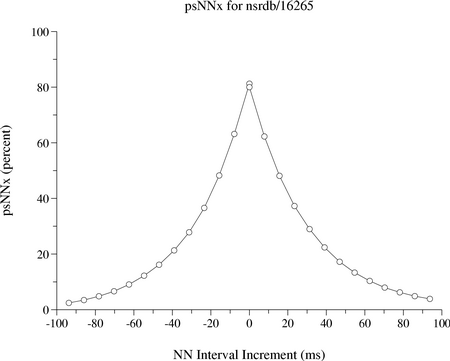
In the figure below is plotted the signed pNNx distribution in percent vs. the NN interval increment in milliseconds. Here the positive and negative increment distributions are calculated separately. Positive increments occur when a long NN interval follows a shorter one. The Y-axis gives the percentage of NN interval increments with greater magnitudes than each given X-axis negative / positive increment.
This figure was created using pNNx and plt, as follows:
   pNNx -r nsrdb/16265 -a atr -s >16265.psNNx
   ( plt 0 1 -xa -100 100 10 -ya 0 100 10 -t "psNNx for nsrdb/16265" \
        -x "NN Interval Increment (ms)" -y "psNNx (percent)" -T lw <16265.psNNx
     plt 0 1 -pS0 -X -100 100 -Y 0 100 -setxy -T lw <16265.psNNx ) | \
   lwcat -png >16265.psNNx.png