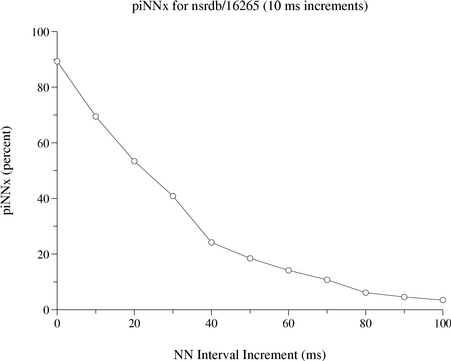
In the figure below is plotted the pNNx distribution in percent vs. the NN interval increment, computed for fixed intervals of 0, 10, 20, ... milliseconds. The Y-axis gives the percentage of NN interval increments greater than each given X-axis increment.
This figure was created using pNNx and plt, as follows:
   pNNx -r nsrdb/16265 -a atr -i 10 >16265.pNNx
   ( plt 0 1 -xa 0 100 10 -ya 0 100 10 \
        -t "piNNx for nsrdb/16265 (10 ms increments)" \
        -x "NN Interval Increment (ms)" -y "piNNx (percent)" -T lw <16265.piNNx
     plt 0 1 -pS0 -X 0 100 -Y 0 100 -setxy -T lw <16265.piNNx ) | \
   lwcat -png >16265.piNNx.png