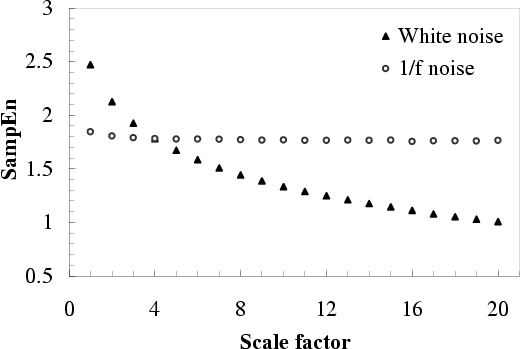
Figure 3 presents the MSE results for simulated uncorrelated (white) and long-range correlated (1/f) noise. Note that for scale one, a higher value of SampEn is obtained for white noise time series than for 1/f time series. Although the value of entropy for the coarse-grained 1/f series remains almost constant for all scales, the value of entropy for the coarse-grained white noise time series monotonically decreases, such that for scales above 4, it becomes smaller than the corresponding values for 1/f noise. In contrast with the conclusions drawn from single-scale entropy-based analyses, the MSE results are consistent with the fact that, unlike white noise, 1/f noise contains correlations across multiple time scales and is, therefore, more complex than white noise [13].
 |